A world divided by the wall
Among the ordinary five-to-seven-floor apartment buildings common in Taipei, there are several buildings hidden behind high walls and surrounded by tall trees in a lane of Mingsheng East Road. The overall look is one of mystery.
These buildings are located in Dongcheng Village, Songshan Dist. The data from Financial Data Center reveals some clues:
| District |
Village |
Total Income of the Village |
Tax Unit |
Average |
First Quartile |
Midian |
Third Quartile |
Standard Deviation |
| Songshan |
Dongcheng |
9836m |
917 |
1.07m |
0.47m |
0.9m |
1.8m |
261760.57 |
Tax Unit
A tax unit is a group of individuals who pay tax as a unit (usually parents and children or spouses). One can also pay tax alone. Our data is based on tax units. Hence, we don't know if the income comes from one single person or is the total from multiple family members. We can consider a tax unit as a co-living group, with those in the group sharing both income and expenditure.
Ordering all tax units in Dongcheng Village from small to large by their incomes, and finding the record exactly in the 25%, 50%, and 75% percentile, we get the first quartile, median and third quartile.
From the data above, we know the residents of Dongcheng Village in the 0-25% percentile earn 0-0.5 million NTD (0-17k USD) yearly. The median income of Dongcheng Village is 0.9 million NTD (30k USD). This ranks it 37th out of 456 villages in Taipei; the placement is a decent one, but not at the top. The third quantile pulls in 1.8 million NTD (60k USD) a year. It ranks 59, still far from the top tiers.
The Insane Amount of Income Behind the Wall
Dongcheng Village seems ordinary – as the buildings surrounded by trees are – when it comes to income distribution in Taipei.
However, the average (as compared to median) income in the village has long occupied the No. 1 spot in Taipei and even the whole of Taiwan for years. In the 2014 statistics, the village's average income is an amazing 10.7 million NTD (0.36 million USD)!
The average income of Dongcheng Village is far from its median, and also much higher in terms of multiples than its third quantile. This suggests that there are one or more taxpayers who earn an insane amount of money yearly.
We can derive a simple estimate of the amount. Let's assume all tax units in the 0-25% quantile each earn 0.5 million NTD (17k USD), those in the 25-50% quantile each earn 0.9 million NTD (30k USD), and those in the 50-75% bracket each earn 1.8 million NTD (60k USD). For the 75-100% quantile, let's assume a 20 million NTD (0.67 million USD) figure. We then have the total income of the village minus the previously assumed amount of income. Dividing this figure by a pre-set number of tax units gives us the annual income of the super-earners in Dongcheng Village.
Assumption 1: 10 hyper income tax units
| Income GroupAssumed Income |
25%0.47m |
50%0.9m |
75%1.8m |
100%20m |
Hyper Income Units |
| Units |
230 |
230 |
230 |
217 |
10 |
| Group Total Income |
110m |
215m |
418m |
4340m |
4754m |
| Average Income of Each Unit |
|
|
|
|
~470m |
Assumption 2: 50 hyper income tax units
| Income GroupAssumed Income |
25%0.47m |
50%0.9m |
75%1.8m |
100%20m |
Hyper Income Units |
| Units |
230 |
230 |
230 |
177 |
50 |
| Group Total Income |
110m |
215m |
418m |
3540m |
5554m |
| Average Income of Each Unit |
|
|
|
|
~110m |
As a result, the mysterious super-earners must each have an annual income of at least 100 million NTD (3 million USD). The real number should be more since we overestimated other tax units' income. If we examine the numbers in detail, we can find the combined income of the other tax units would be slightly less than that of the super-earners.
Where is the wealthy neighborhood?
How many villages in Taipei have such similarly huge income inequality?
Figure 1. Income Inequality Within District
In Figure 1, we plot the statistics of the top 10 villages by average income. We can see what these villages are and how the average income in each differs from its median and third quantile.
10%?1%?0.1%?
We may imagine that the commonly thought wealthy districts, such as Daan District in the central of Taipei, are home to the top 10% of wealthy people, to be specific, the top 10% earners. The villages with super-high average income have the top 1% wealthy people. Where do such rich people live? Everyone is curious about the answer to that question. Through mapping and statistics, we can try to understand the geographical distribution of high-income people.
Besides satisfying the curiosity about where rich people live, we have more questions based on the explorations above: Are wealth persons' incomes stable? What's the difference between their income sources and those of average people? Do these differences tell us anything? In the following research, we will continue to explore these questions through financial and available tax data. If we find anything interesting, we will share it.
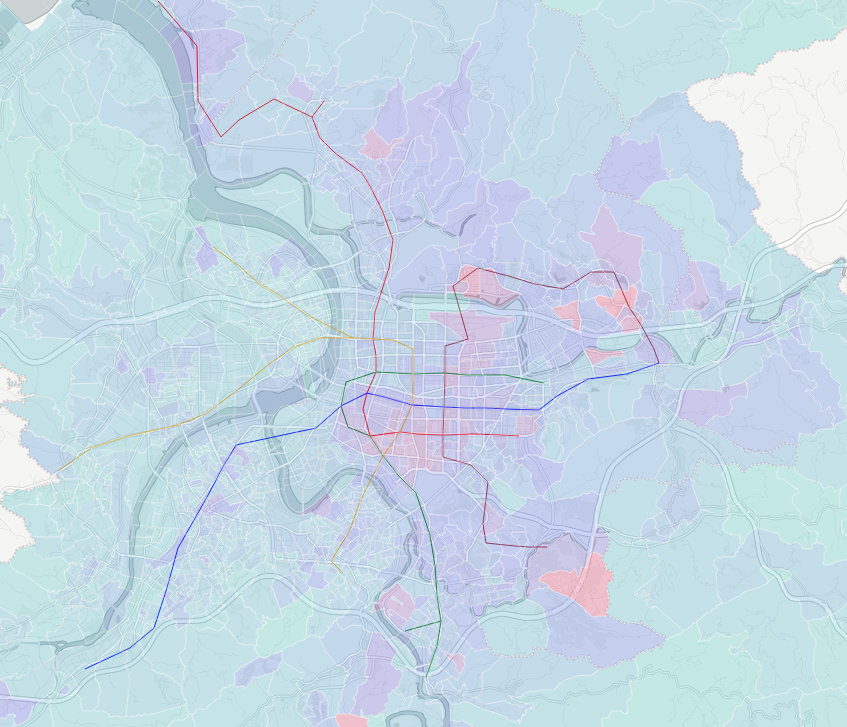
Interactive Map: Taipei's Income Distribution
A heat map of 2014 median annual income of villages in Taipei and New Taipei City. The darker the shade of pink, the higher the median income; the more green, the lower the median income. The median statistics merely give us a general view of the geographical distribution. They cannot show the complete distribution among all households, nor reveal the differences in households. In addition, it does not factor in those residents who did not register their tax status.
The tax data released by Financial Data Center takes a while to process and check so there is usually a two-year delay. This project was originally developed in 2016 and used data that was updated at that time, i.e., data from 2014. Income distribution has changed significantly since then, and we will try to explore and share new findings when we have access to more recent data!
Data Sources
Tax Data: 2014/Financial Data Center of Minstry of Finance 、@leeneil at @cicadatatw's pdf/csv convertion
2012/Open Data Gov Taiwan: Taipei、New Taipei
MRT Station Location: @repeat taipei-metro-stations
Derived from
A Day in Taipei Metro