Data analyst with 5 years of industry experience. Loves to dig into problems with data-driven solutions and visual presentations for better communication. Experienced in Spark, SQL, MongoDB script and Shell for data manipulation and ETL, R and Python for data processing, exploratory data analysis, statistical analysis, chart and infographics drawing (ggplot2, seaborn, Shiny), PowerBI and Tableau for dashboard and reporting, and D3.js for interactive graph and storytelling.
An interactive data visualization project. On Nov 24 2018, ten referendums were held in Taiwan alongside the midterm local elections. We hope to help you understand what the results are.
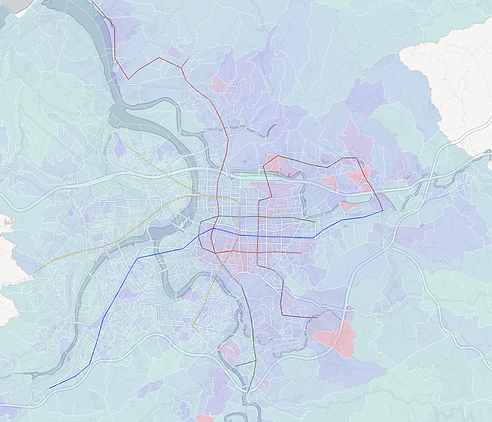
WebsiteAn interactive story of the income distribution in Taipei. A visual presentation of thousands of rows income open data.
Website