[01]
A practical repository of GenAI notes, patterns, and implementation guidance for building with modern language models.
View project →
[02]
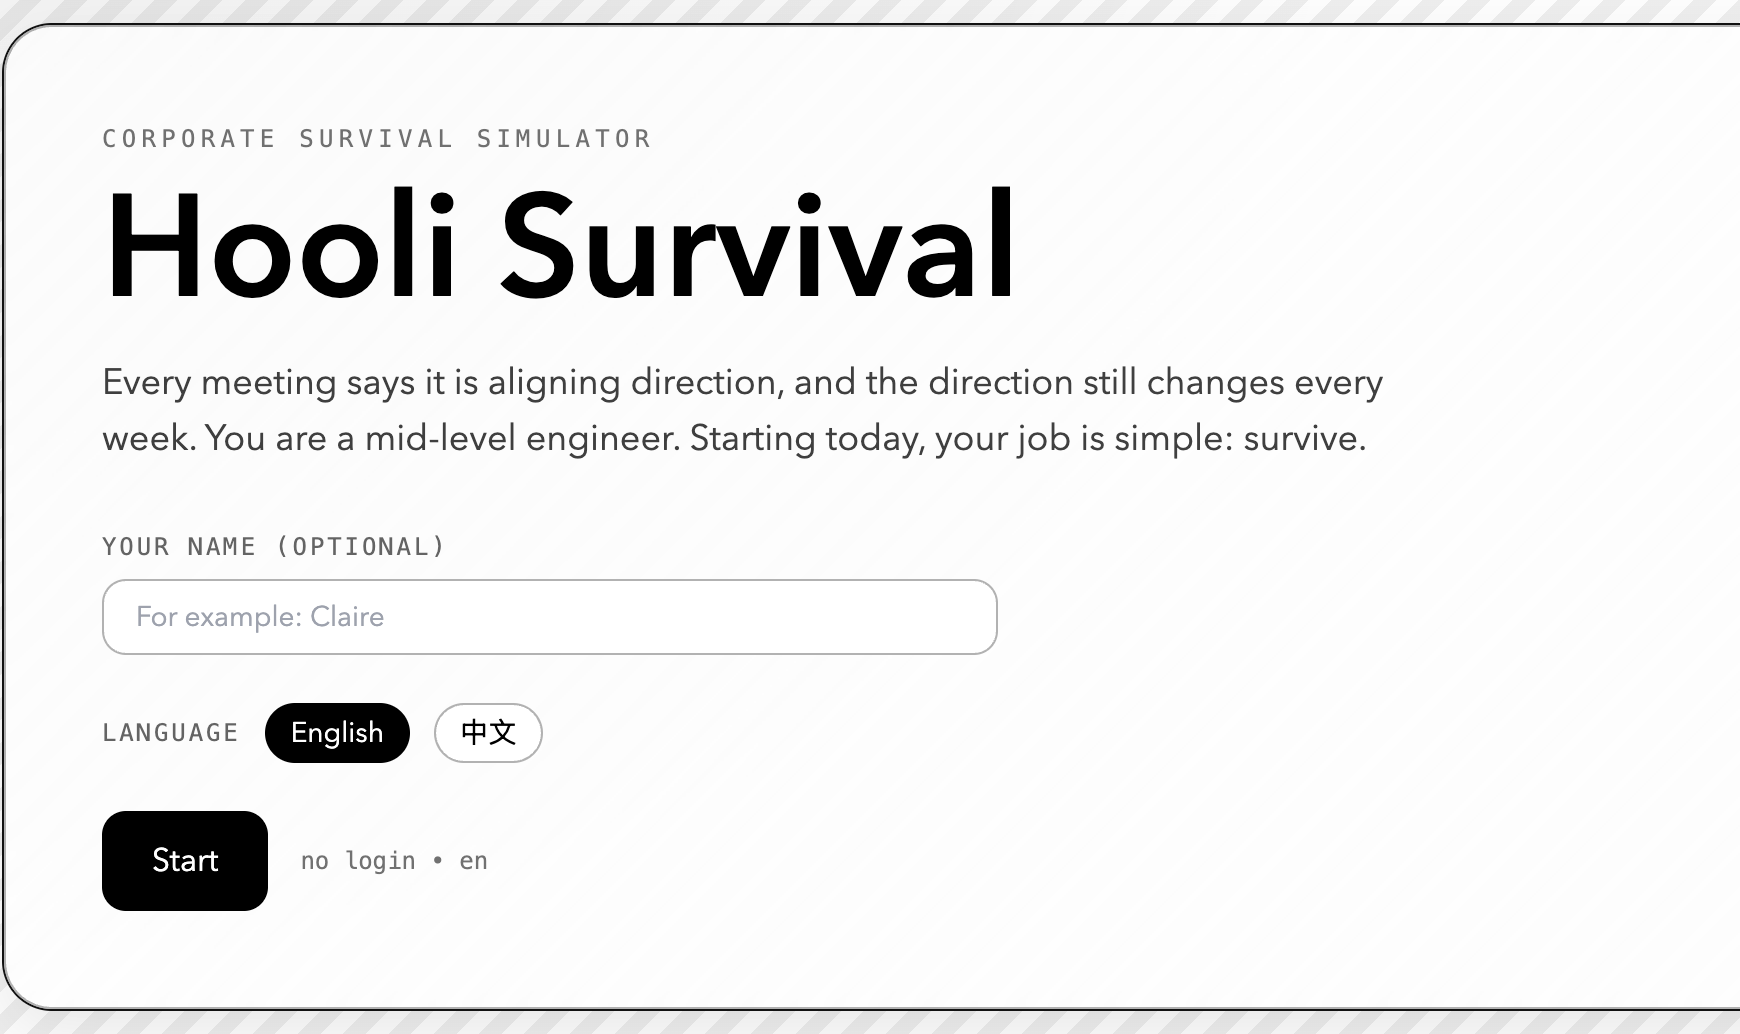
An AI-powered satirical office sim where players navigate realistic big-tech dynamics, with users citing it as effective for interview prep and workplace training.
View project →
[03]
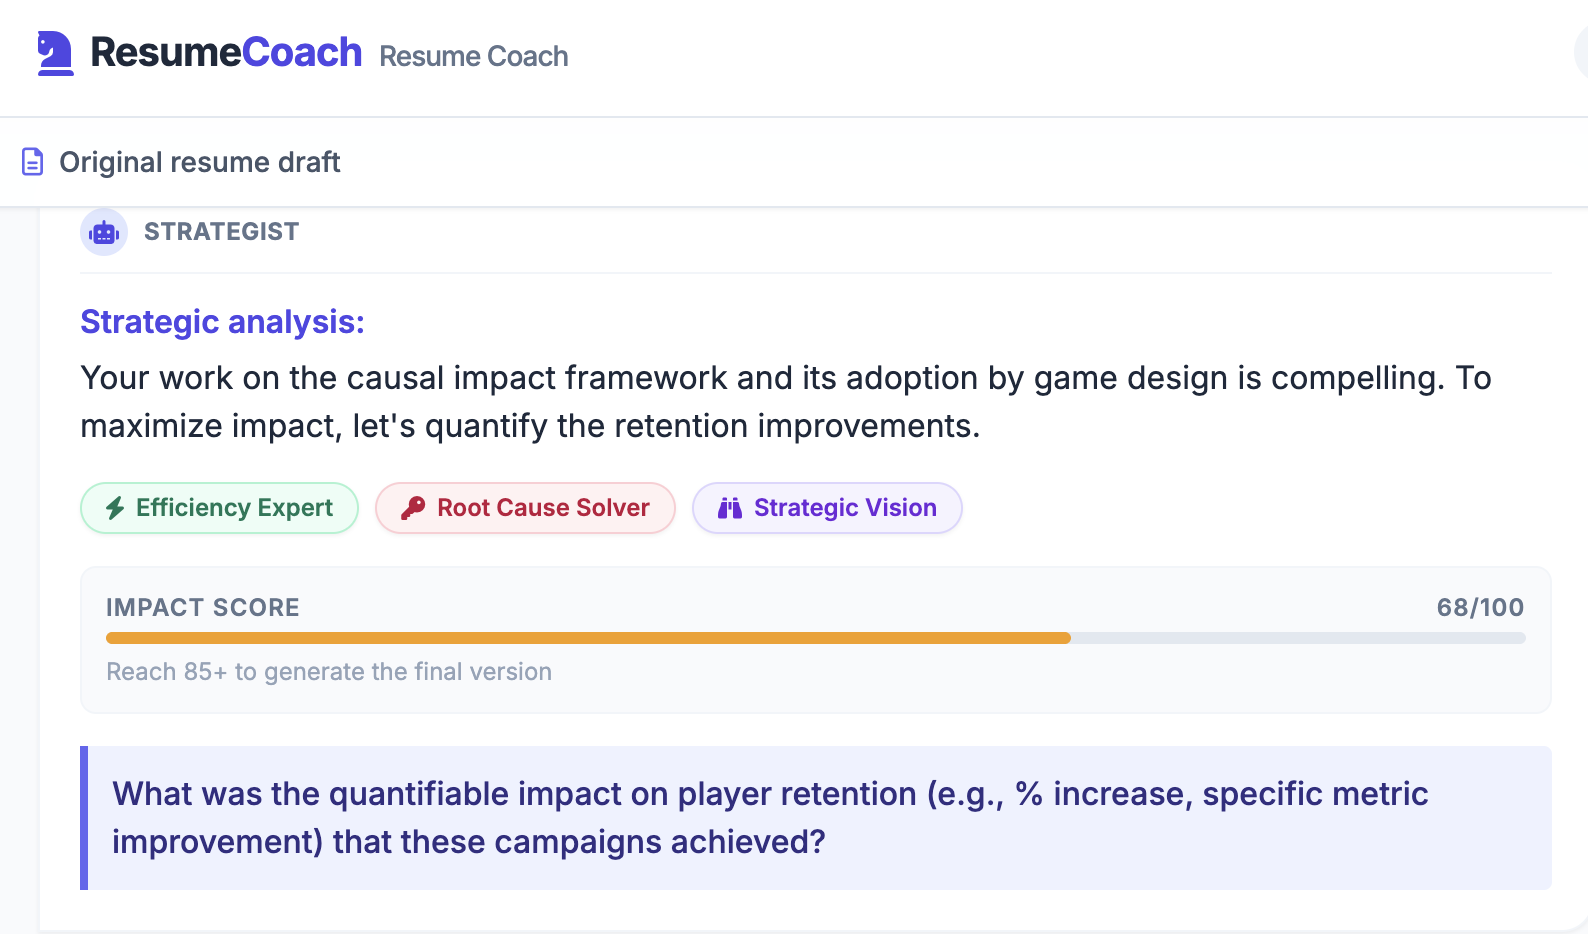
An AI-guided resume tool that interviews users about their experience and turns it into sharper, more targeted resume bullets.
View project →
[04]
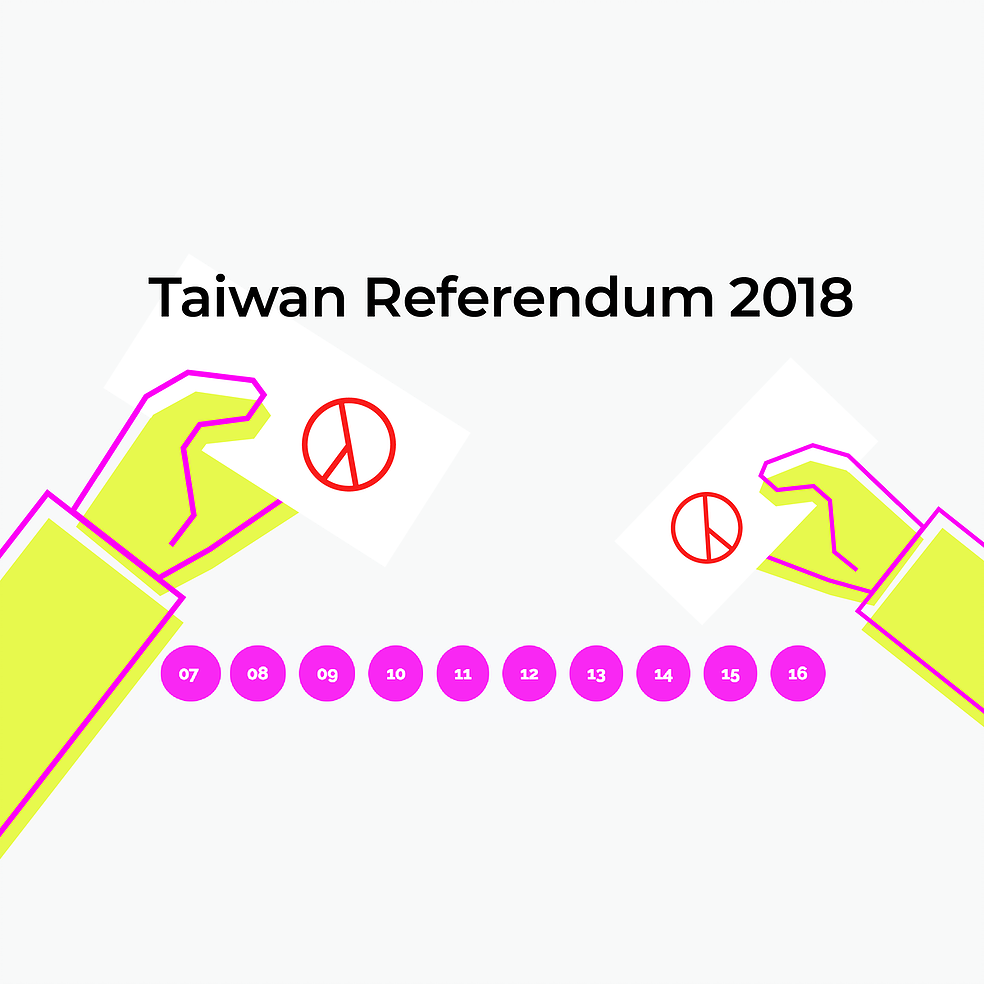
On November 24, 2018, ten referendums were held in Taiwan alongside midterm local elections. An interactive data visualization to help people understand what the results meant.
View project →
[05]
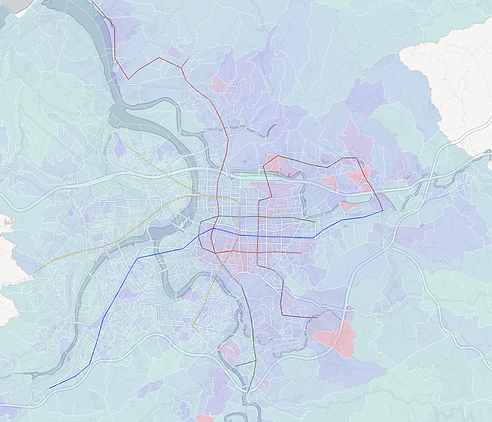
A visual story of income distribution across Taipei, built from thousands of rows of open data. Income inequality made navigable.
View project →